
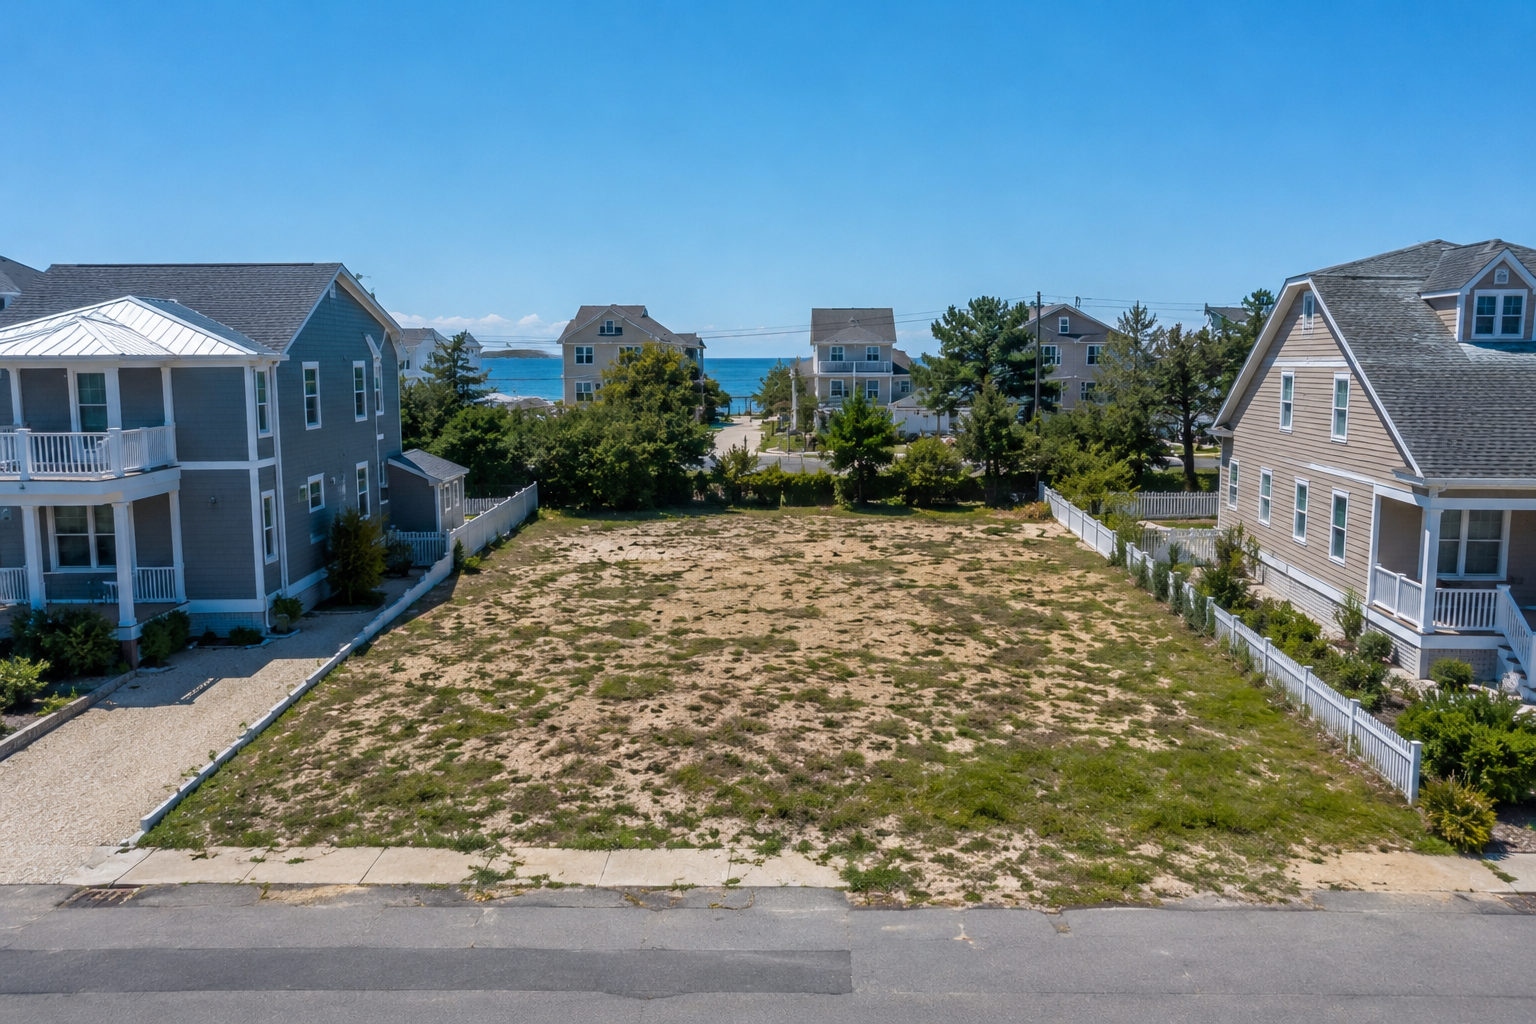
Cost of Holding Calculator: What Your Land Is Costing You
This is a forward-looking tool. It's not a judgment of your past decision — it's a look at what your land is costing you going forward, and what the same capital could generate if it were working somewhere else.
Your Property
What this lot costs you each year
Property taxes ($1,500) plus opportunity cost ($8,400) — the difference between what your capital could earn at ~10% vs. your expected 3% appreciation.
In other words, over any reasonable horizon at your inputs, capital deployed elsewhere is expected to grow faster than the lot itself.
Difference between $15,000 invested in the S&P 500 over 31 years and today's lot value. Shown for context, not as a criticism of the original purchase.
Curious what we'd offer for your property?
Find out in 24 hours — no obligation.
This calculator uses historical S&P 500 returns (approximately 10% annual average) as an illustrative comparison. Past investment returns do not guarantee future results. This is not financial advice. Consult a licensed financial advisor before making investment decisions.